Zuzia in screenshots
A tour of the panel, screen by screen: servers, websites, scheduled tasks and the MCP server for AI assistants. The data comes from a demo account, so the server names and domains are made up.
Servers
Install the agent on a Linux server and it shows up here with its metrics, services, logs and audit results.
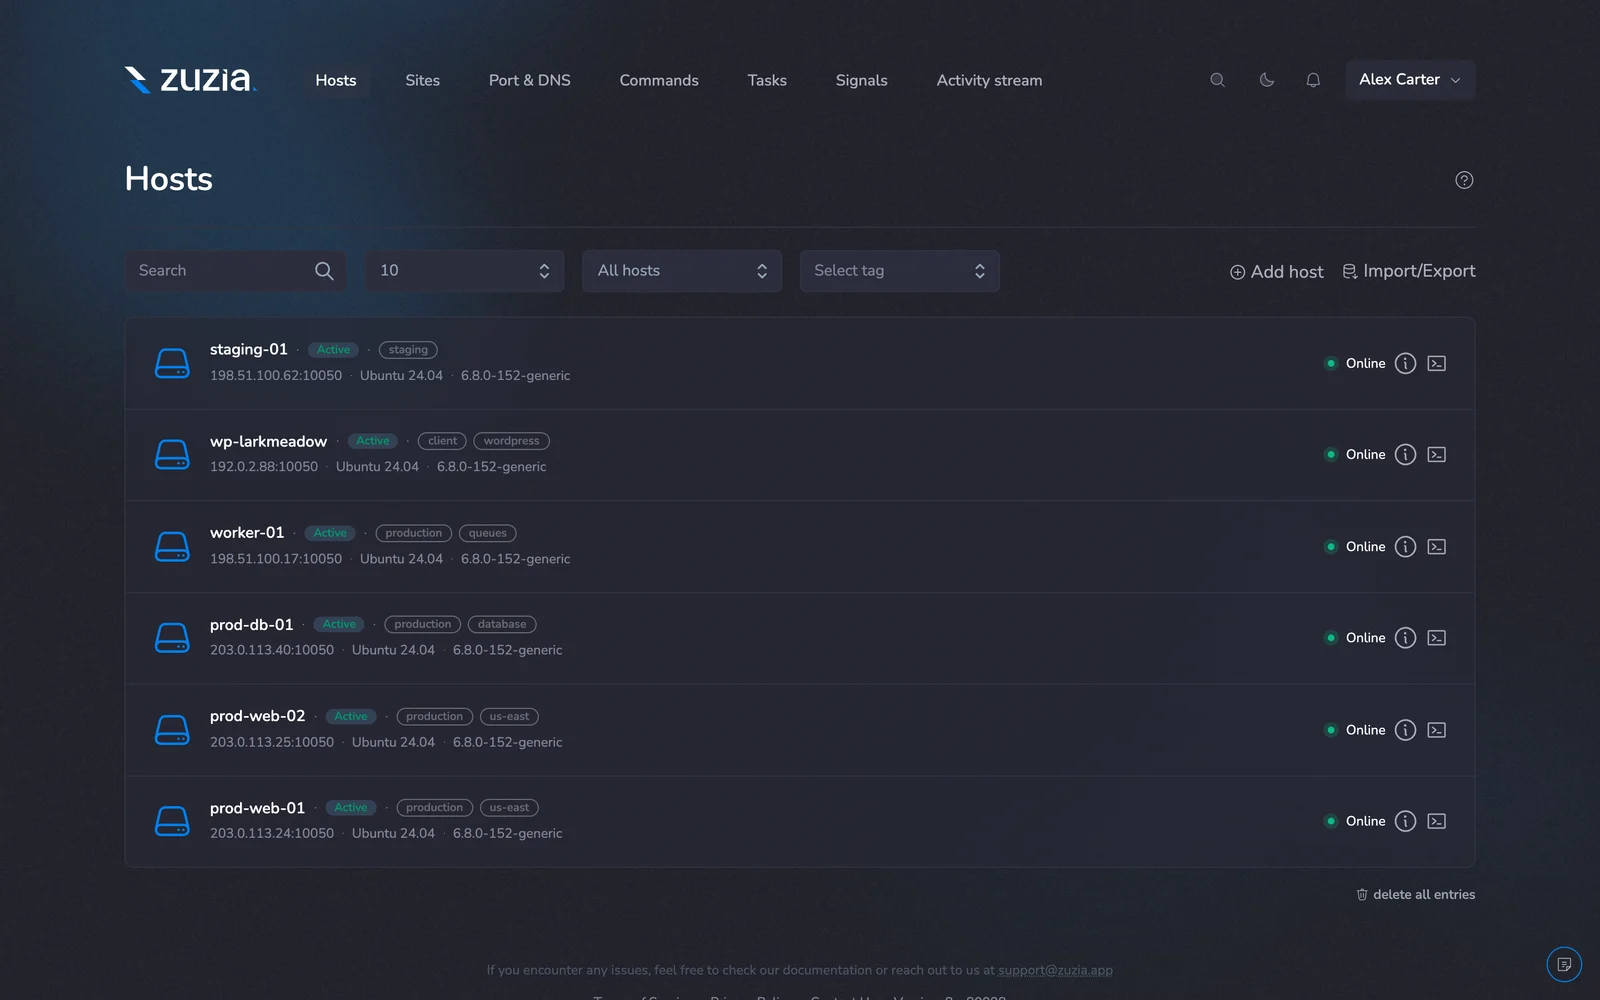
All servers in one list
Every server with its tags, operating system, kernel version and current status. Search, filter by tag, or import servers from CSV and Laravel Forge.
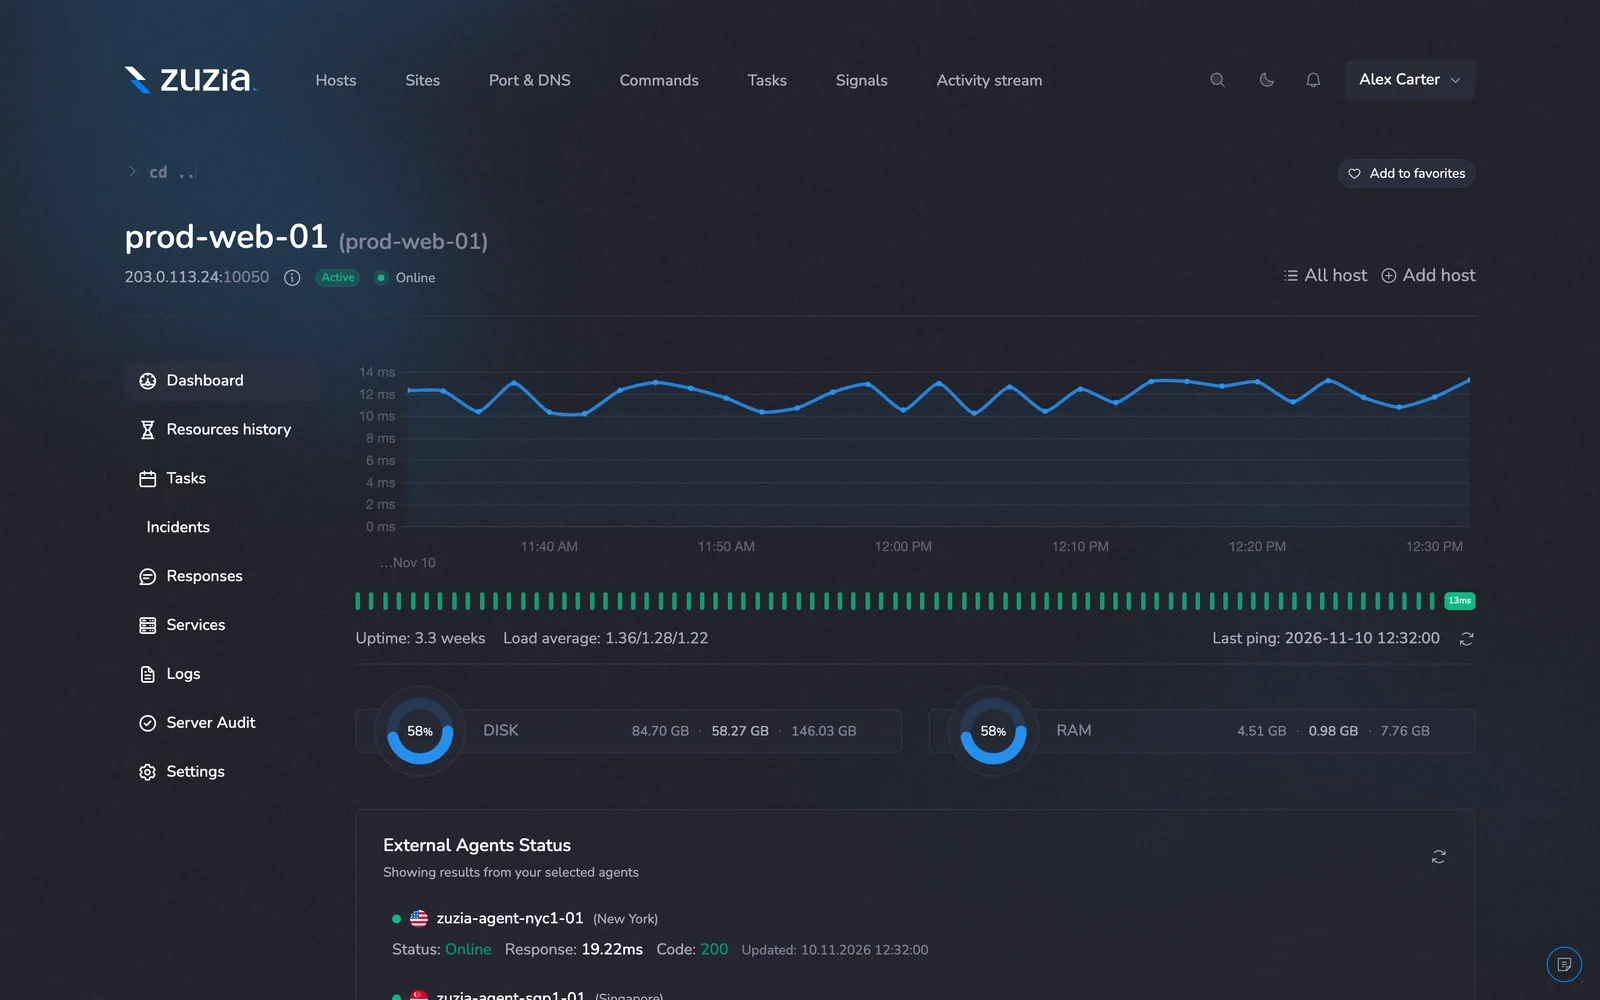
Server dashboard
One server at a glance: response time, uptime, load average, disk and RAM usage, plus ping results from Poland, New York and Singapore.
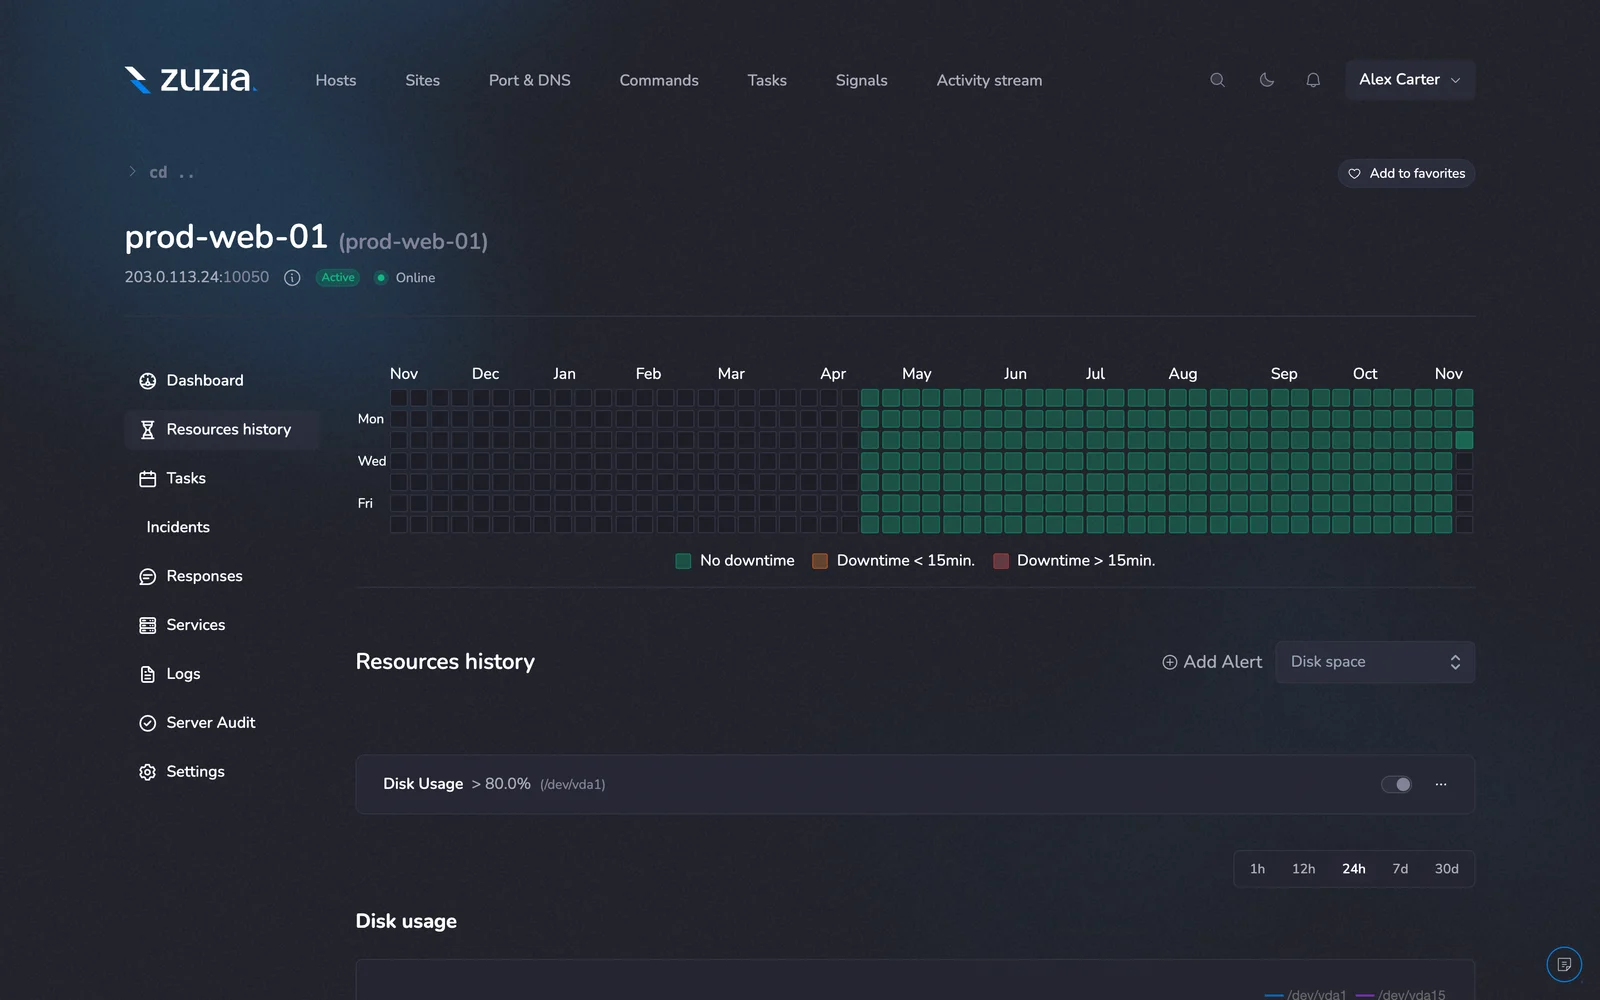
Disk usage history and alerts
A calendar of downtime for the past year and the history of disk usage. Alert rules, like disk above 80%, sit right above the chart.
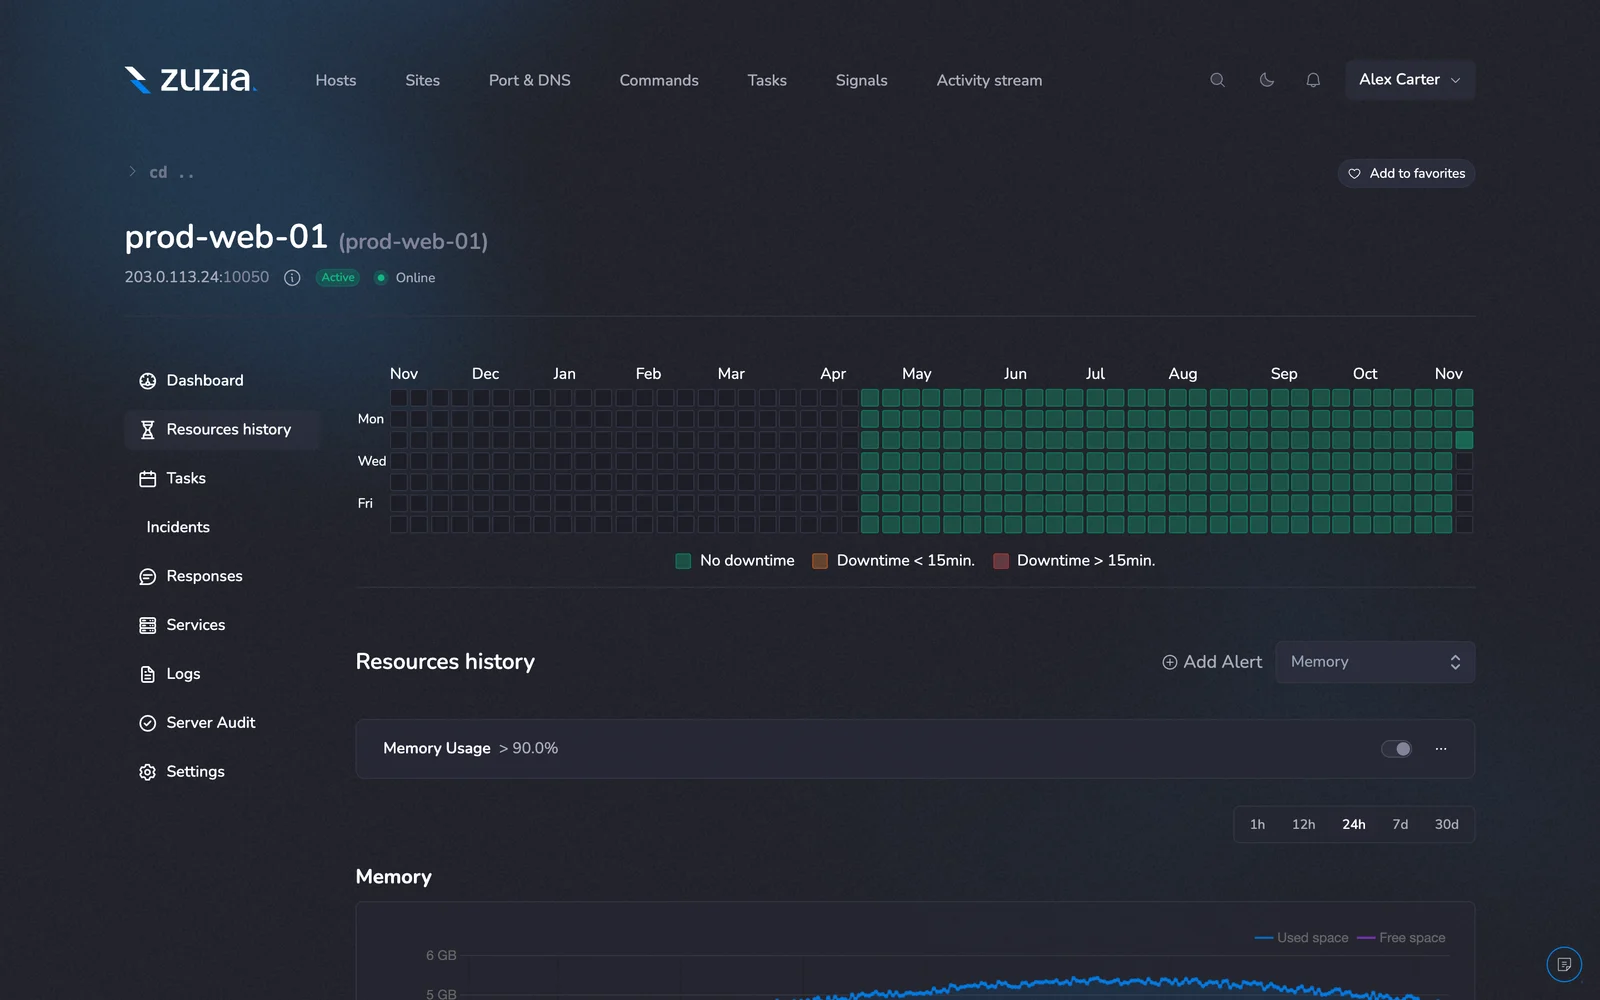
Memory usage history
The same view for memory: used and free space over 1 hour to 30 days, with an alert when usage goes above the threshold you set.
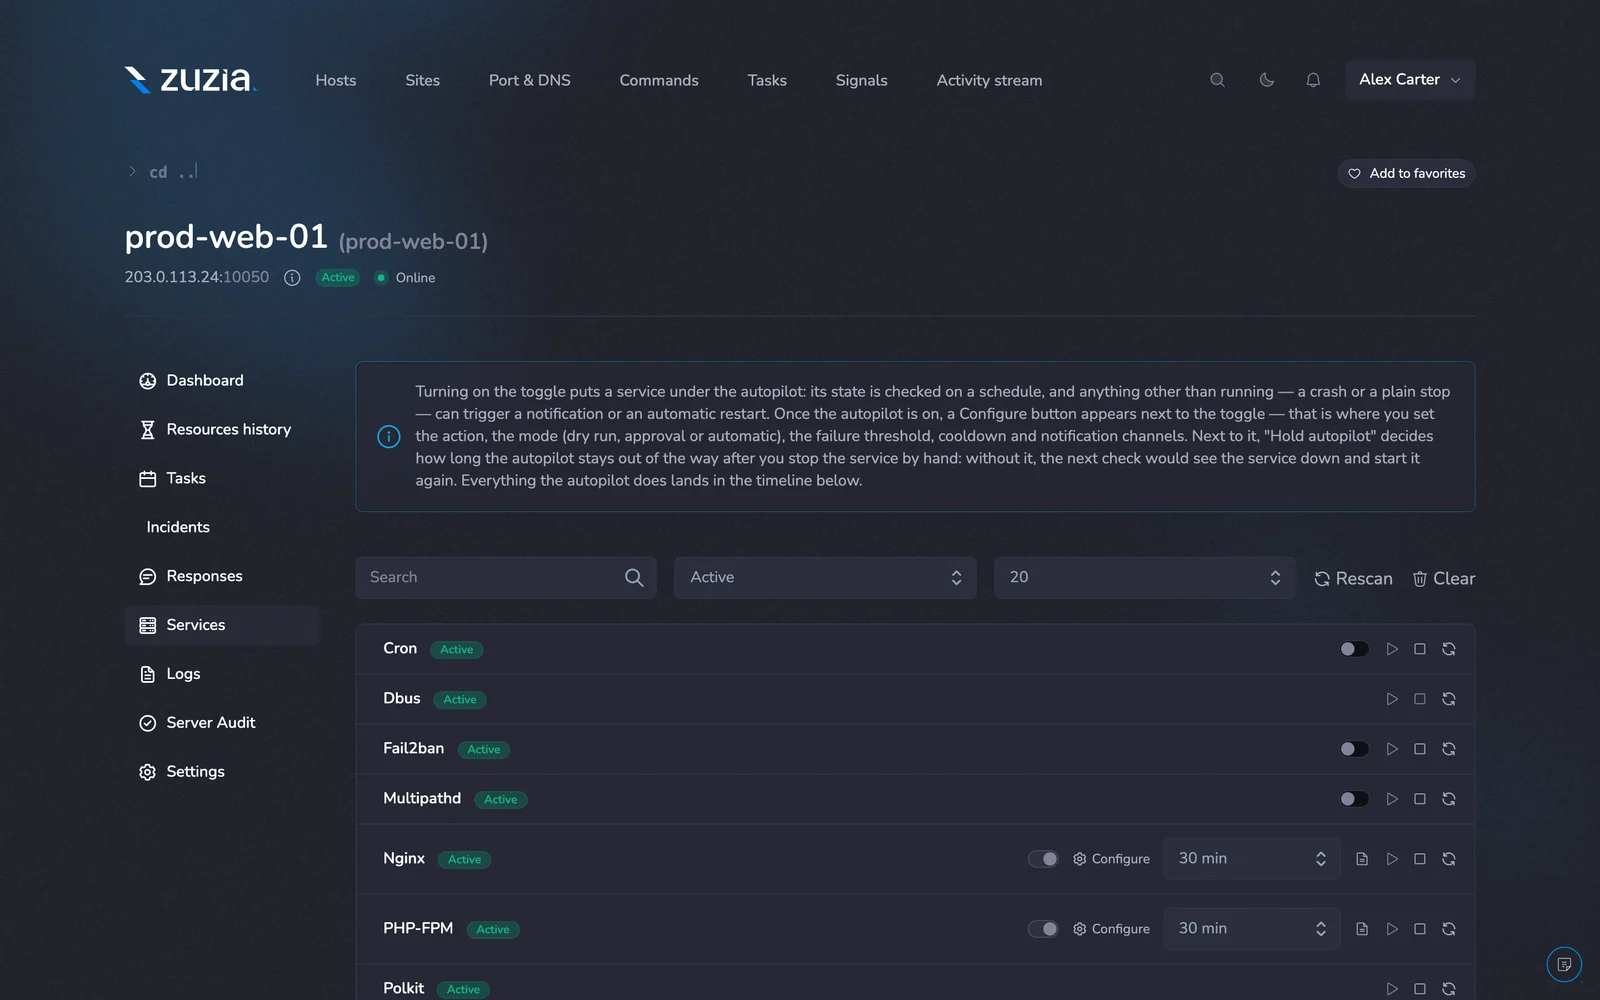
Services and Autopilot
The systemd services found on the server. Turn the toggle on and Autopilot watches the service and can notify you or restart it when it stops, in dry-run, approval or automatic mode.
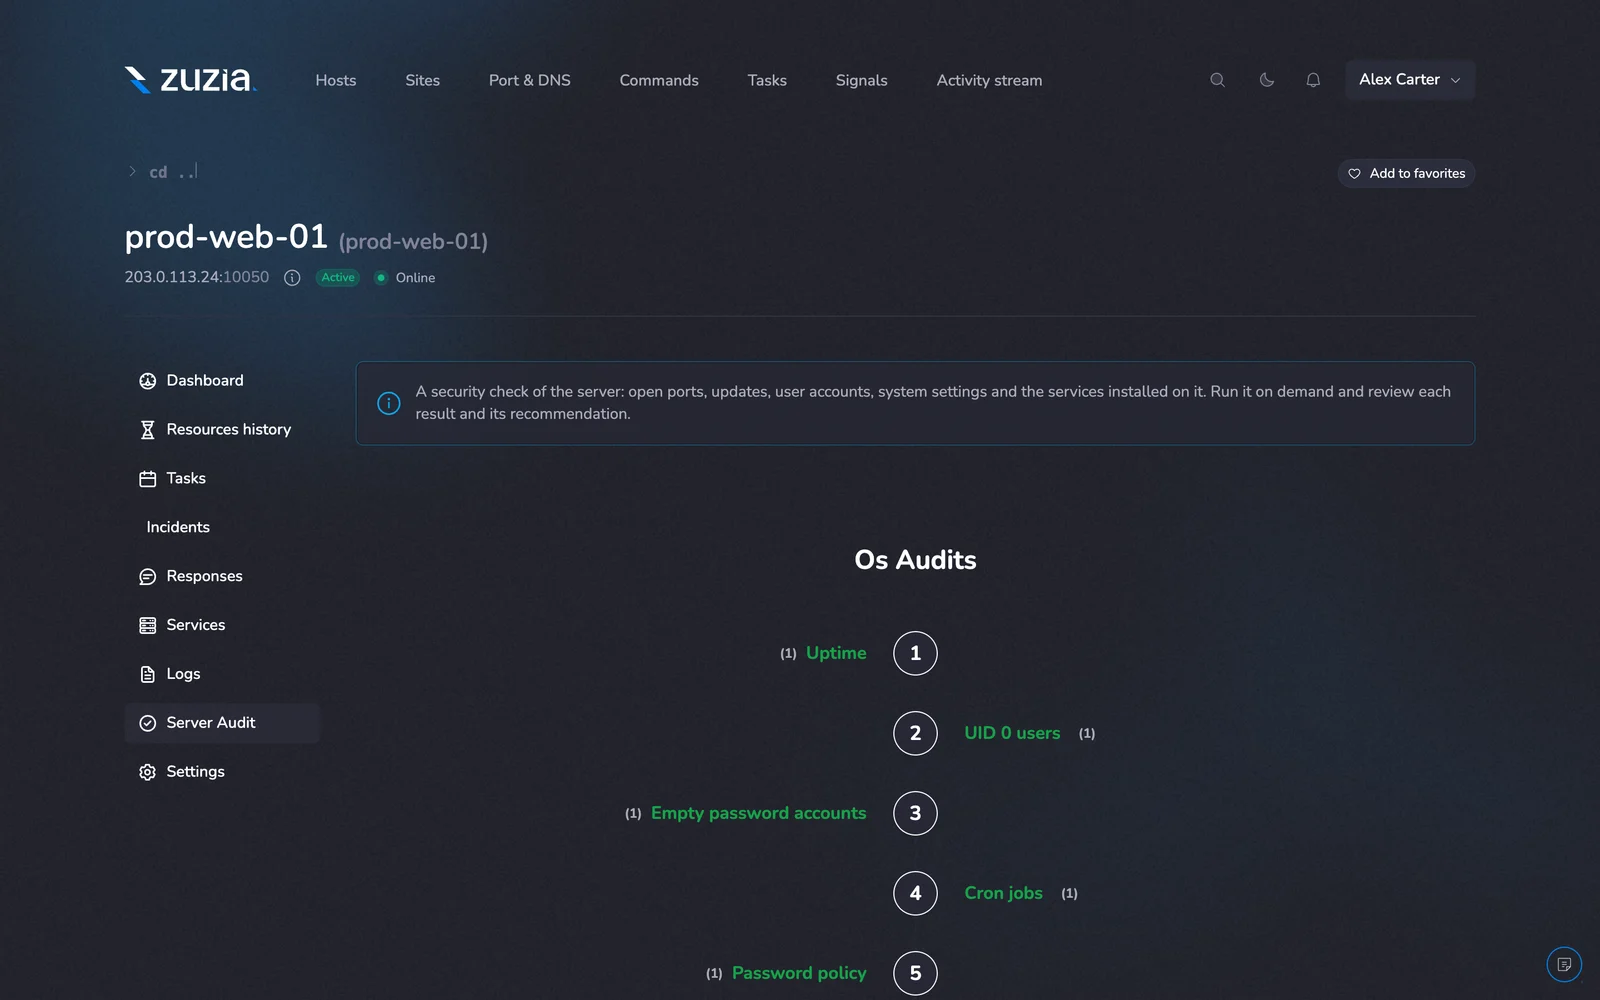
Server audit
A security check of the server run on demand: open ports, updates, user accounts, system settings and installed services, each with a recommendation.
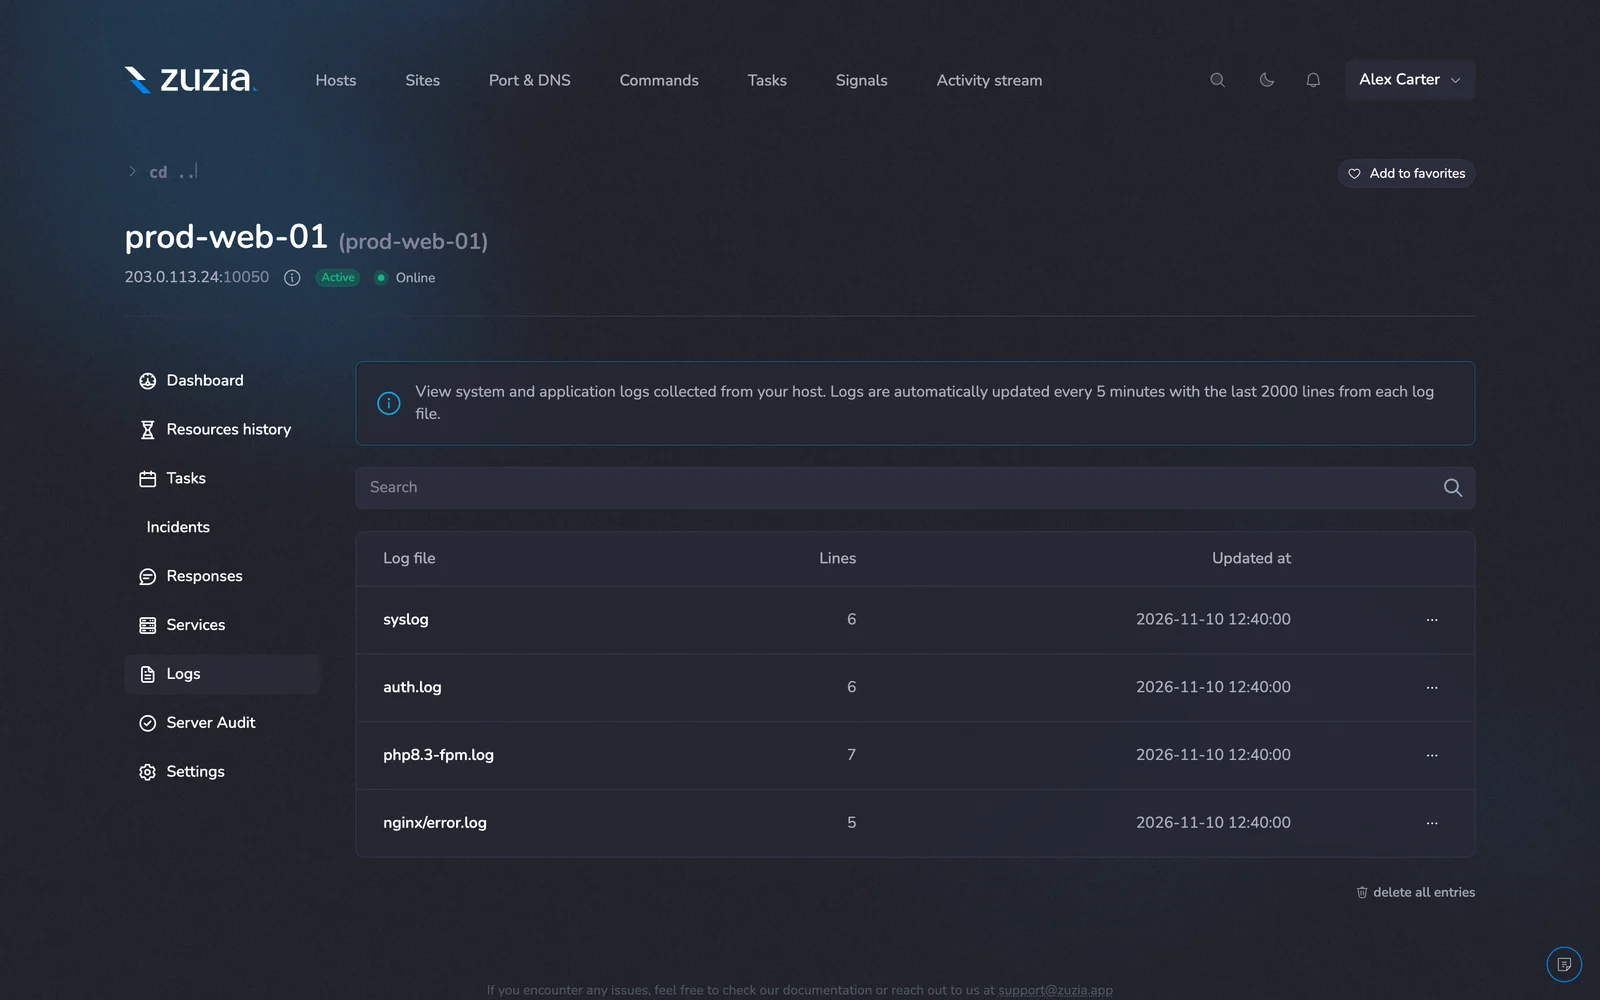
Server logs
System and application logs collected from the server, so you can read syslog, auth.log or the Nginx error log without opening SSH.
Websites, ports and DNS
These checks run from outside. There is nothing to install on the server.
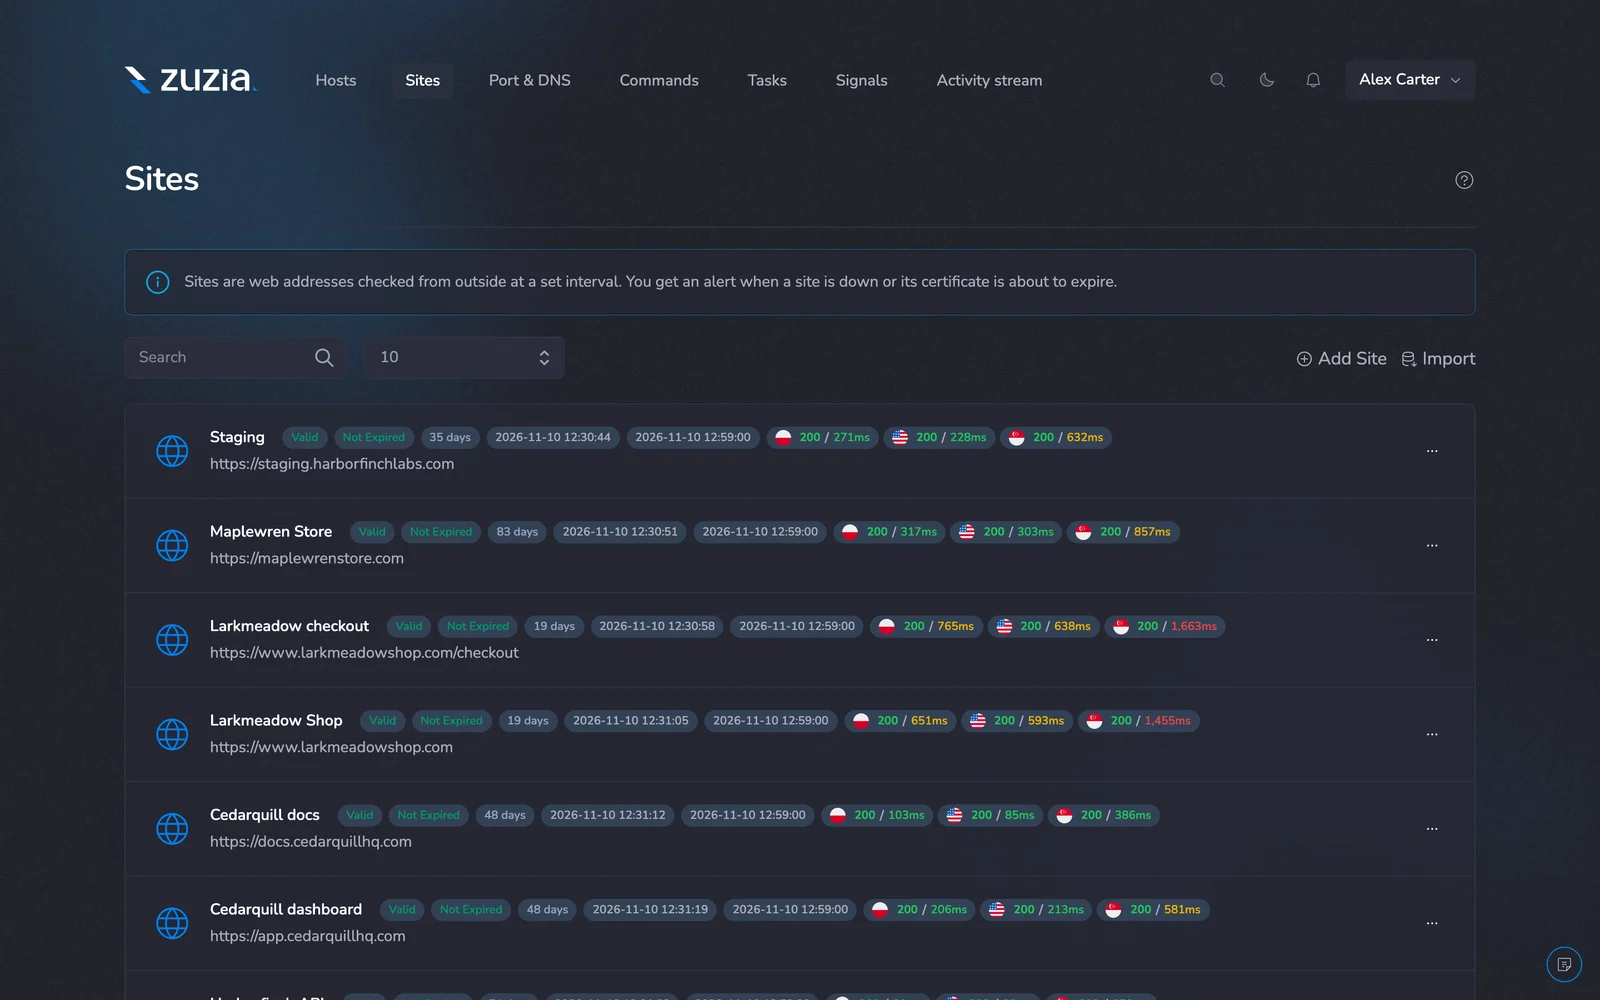
Uptime, SSL and domain expiry
Each website with its SSL status, days left before expiry, and the response code and time measured from Poland, New York and Singapore.
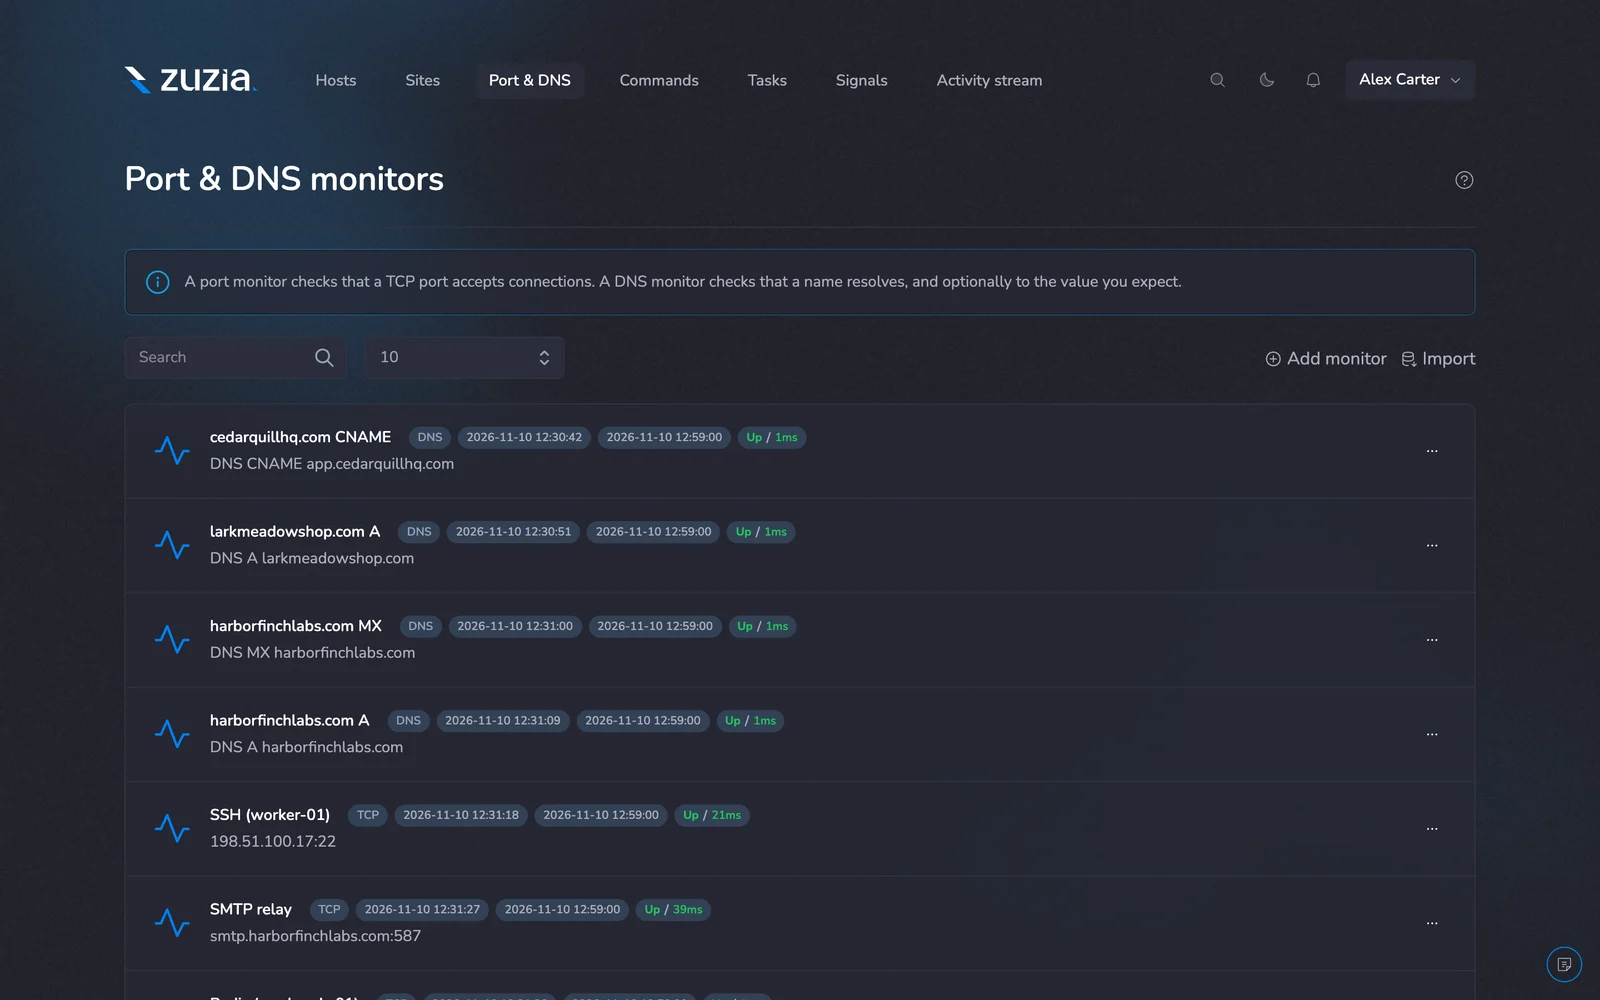
Port and DNS monitors
A port monitor checks that a TCP port accepts connections. A DNS monitor checks that a name resolves, and optionally that it returns the value you expect.
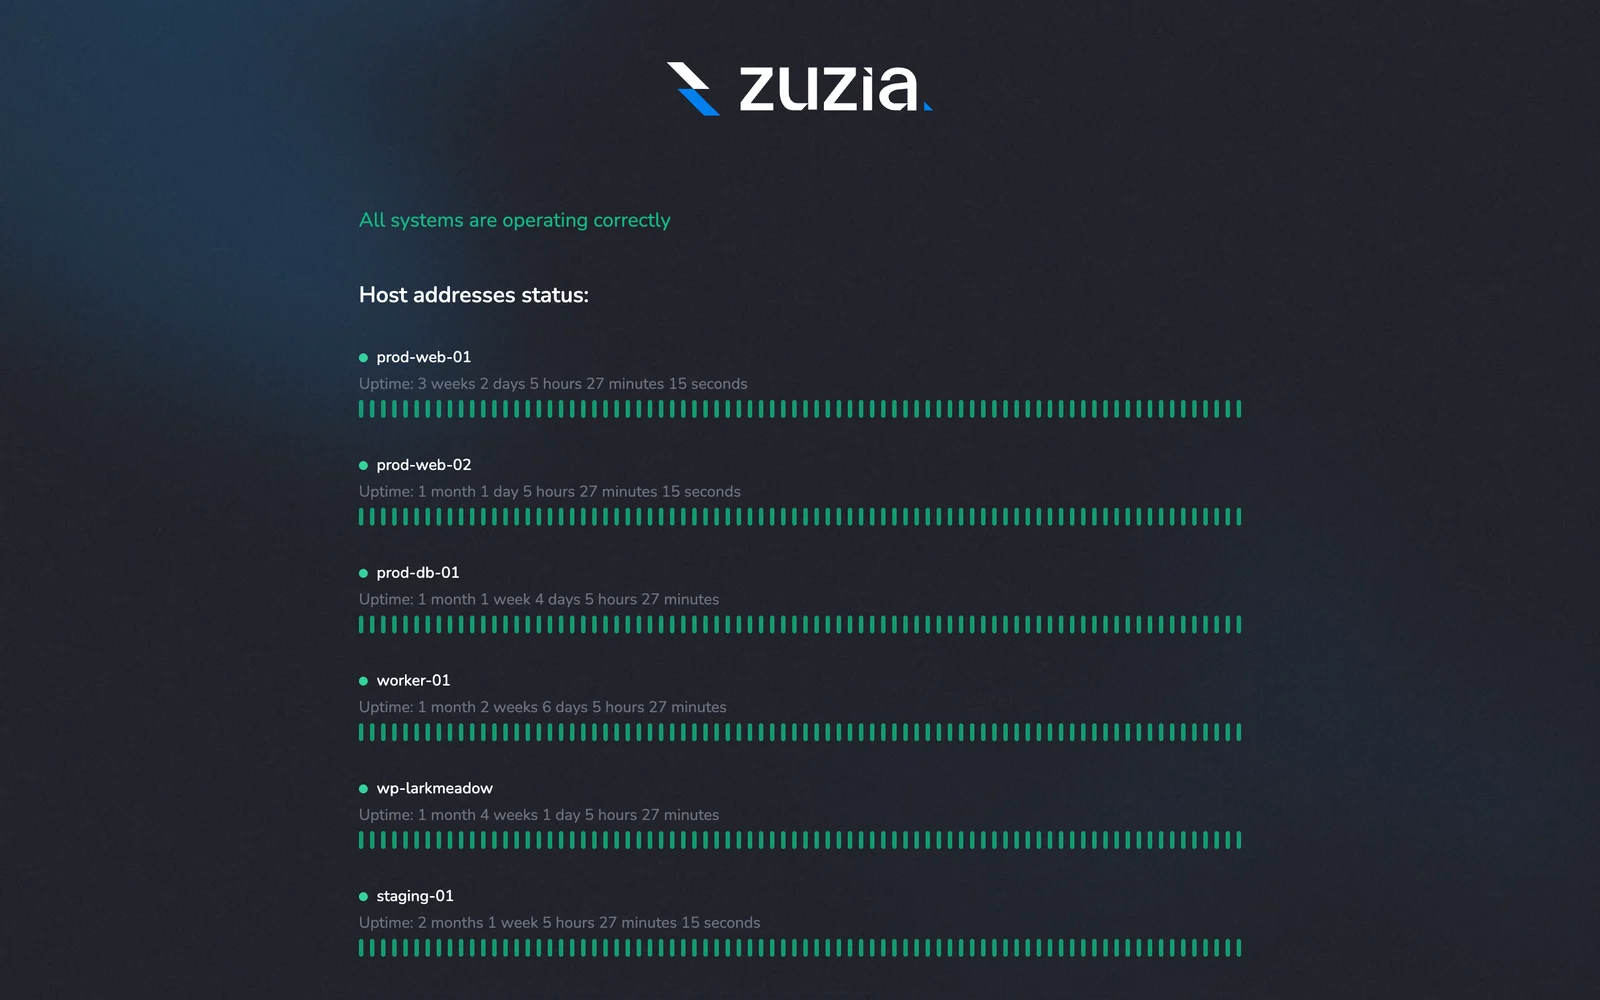
Public status page
A public status page you can share with clients, with the uptime of every server you choose to show.
Tasks and commands
The agent runs your commands on a schedule. A command that reports OK, WARNING or CRITICAL becomes a monitor.
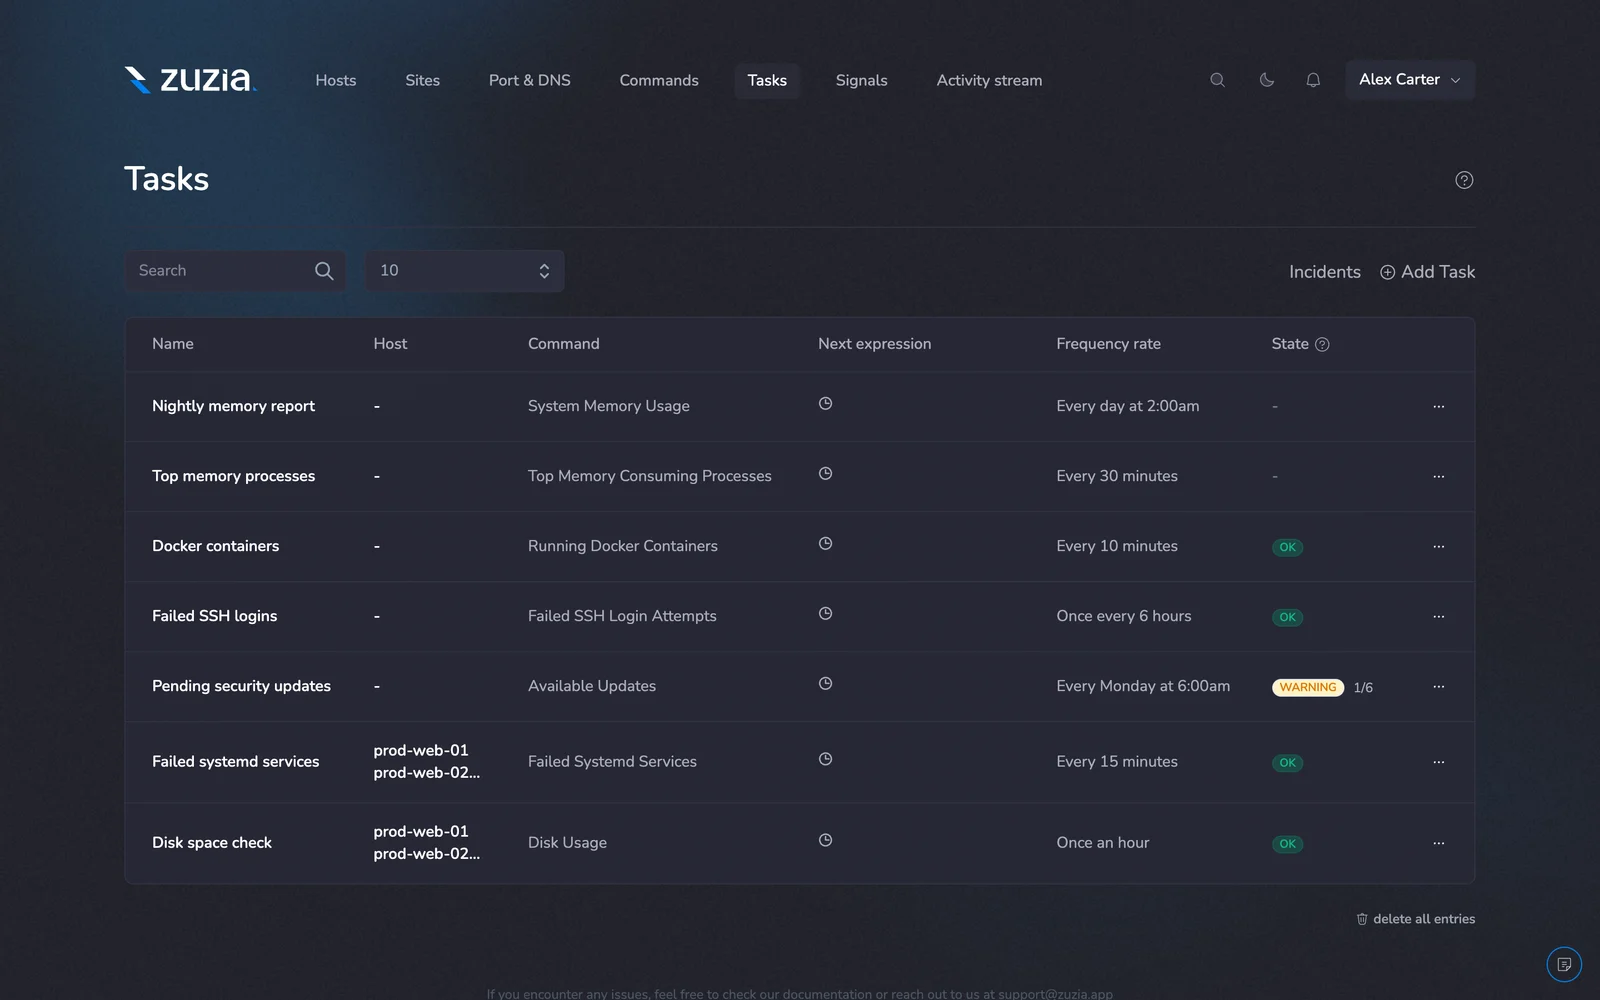
Scheduled tasks
Tasks with their command, hosts, schedule and current state. Disk space, failed SSH logins, pending security updates and Docker containers are checked here on a schedule.
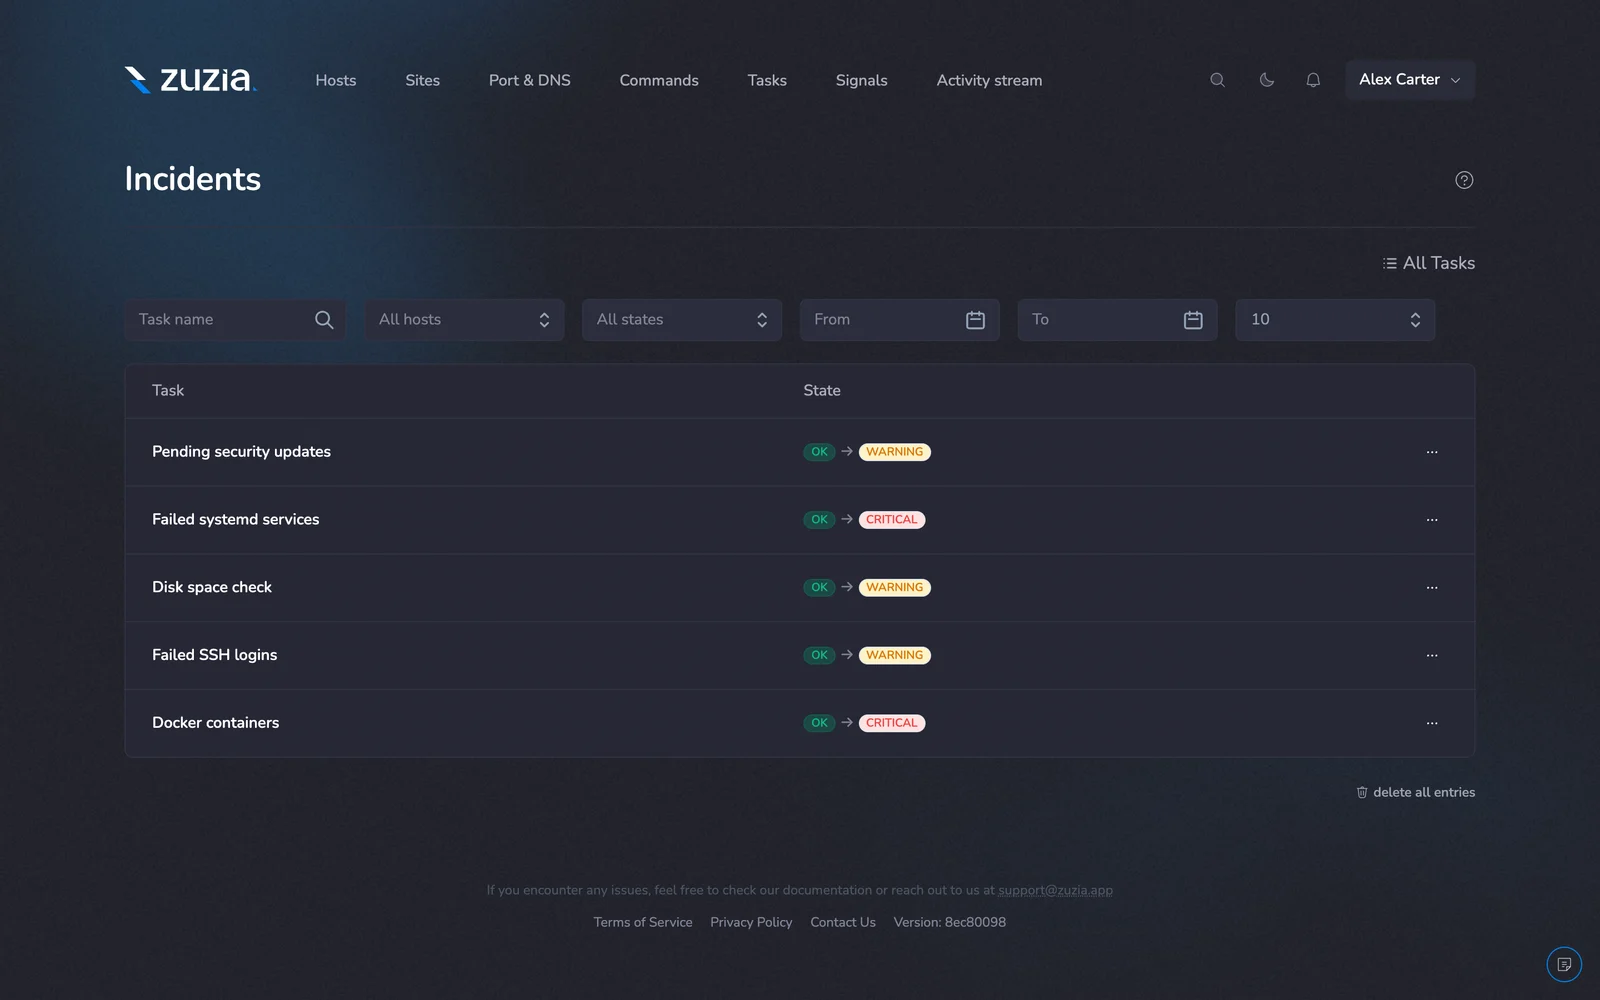
Incidents
Every change of state is an incident: which task went from OK to WARNING or CRITICAL, filterable by host, state and date.
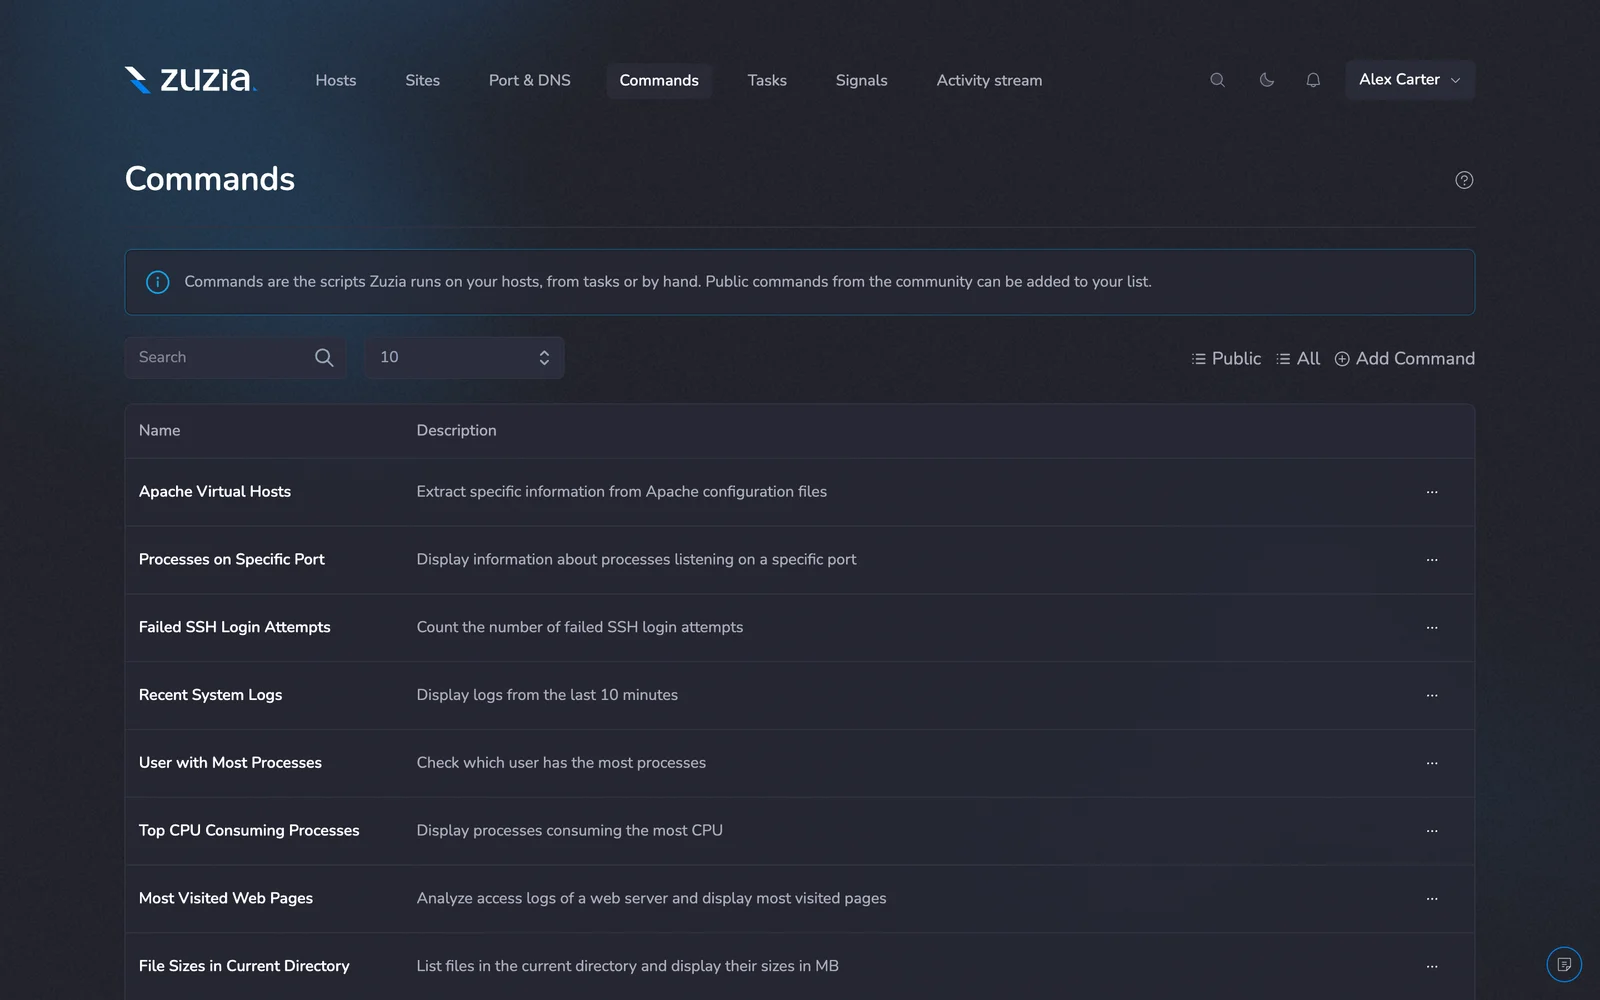
Command library
The scripts Zuzia runs on your servers, from tasks or by hand. Start from the public commands or add your own.
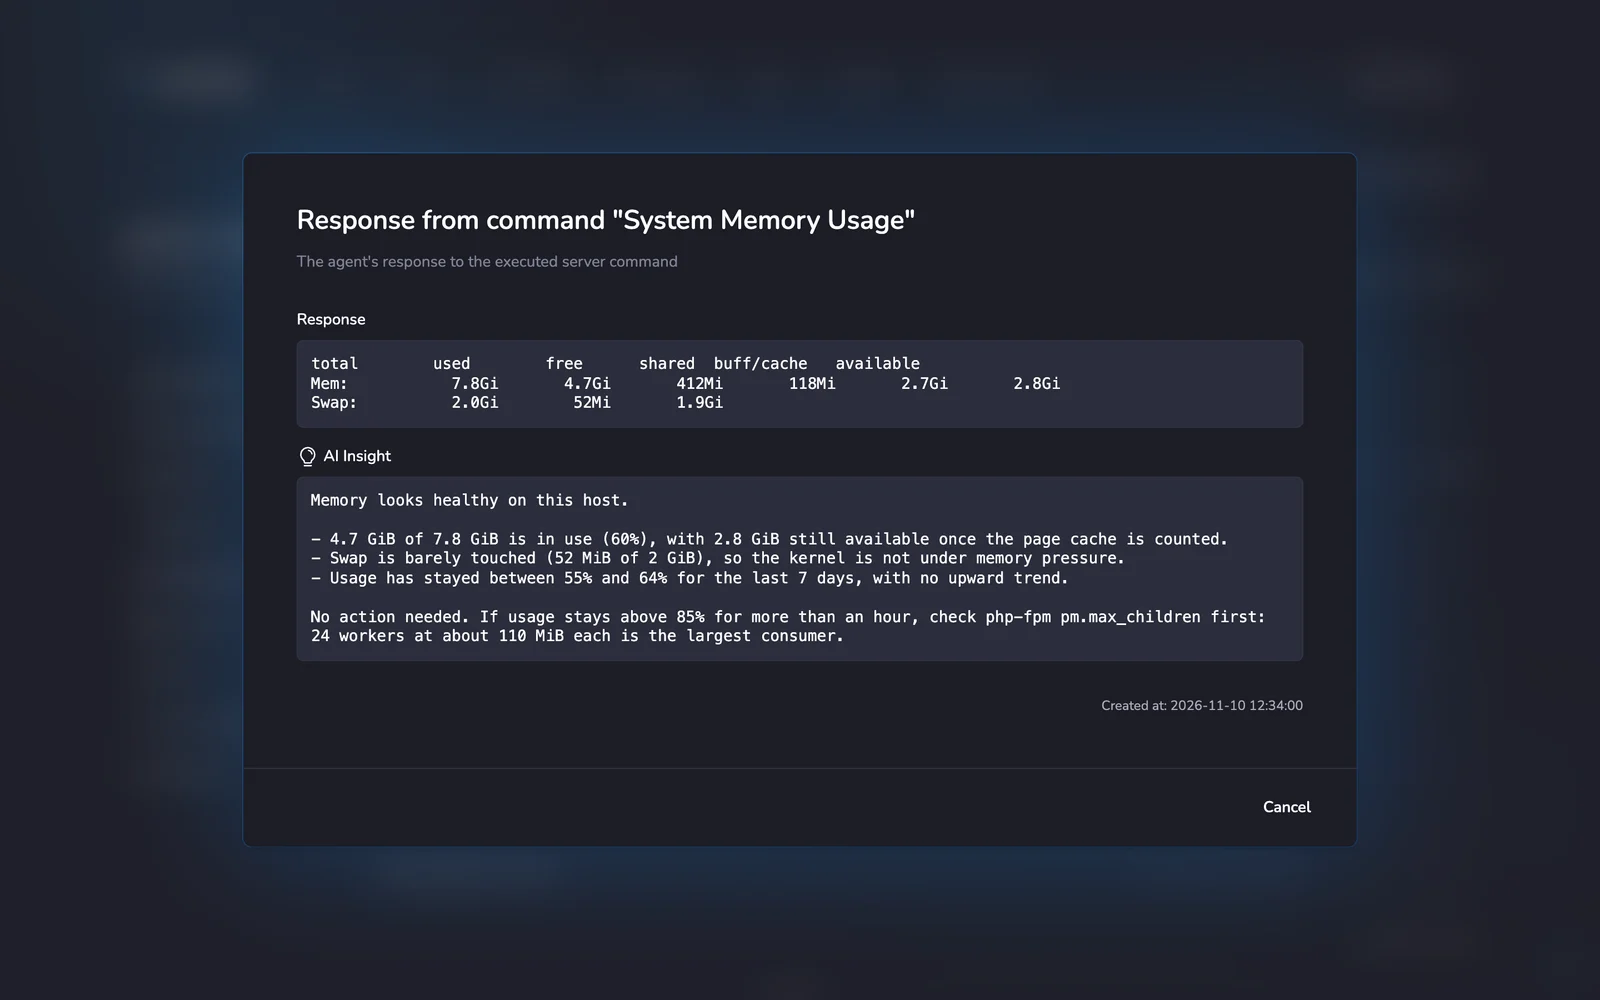
Command output with AI Insight
The raw output of a command, with a plain-language summary of what it means and whether you need to do anything.
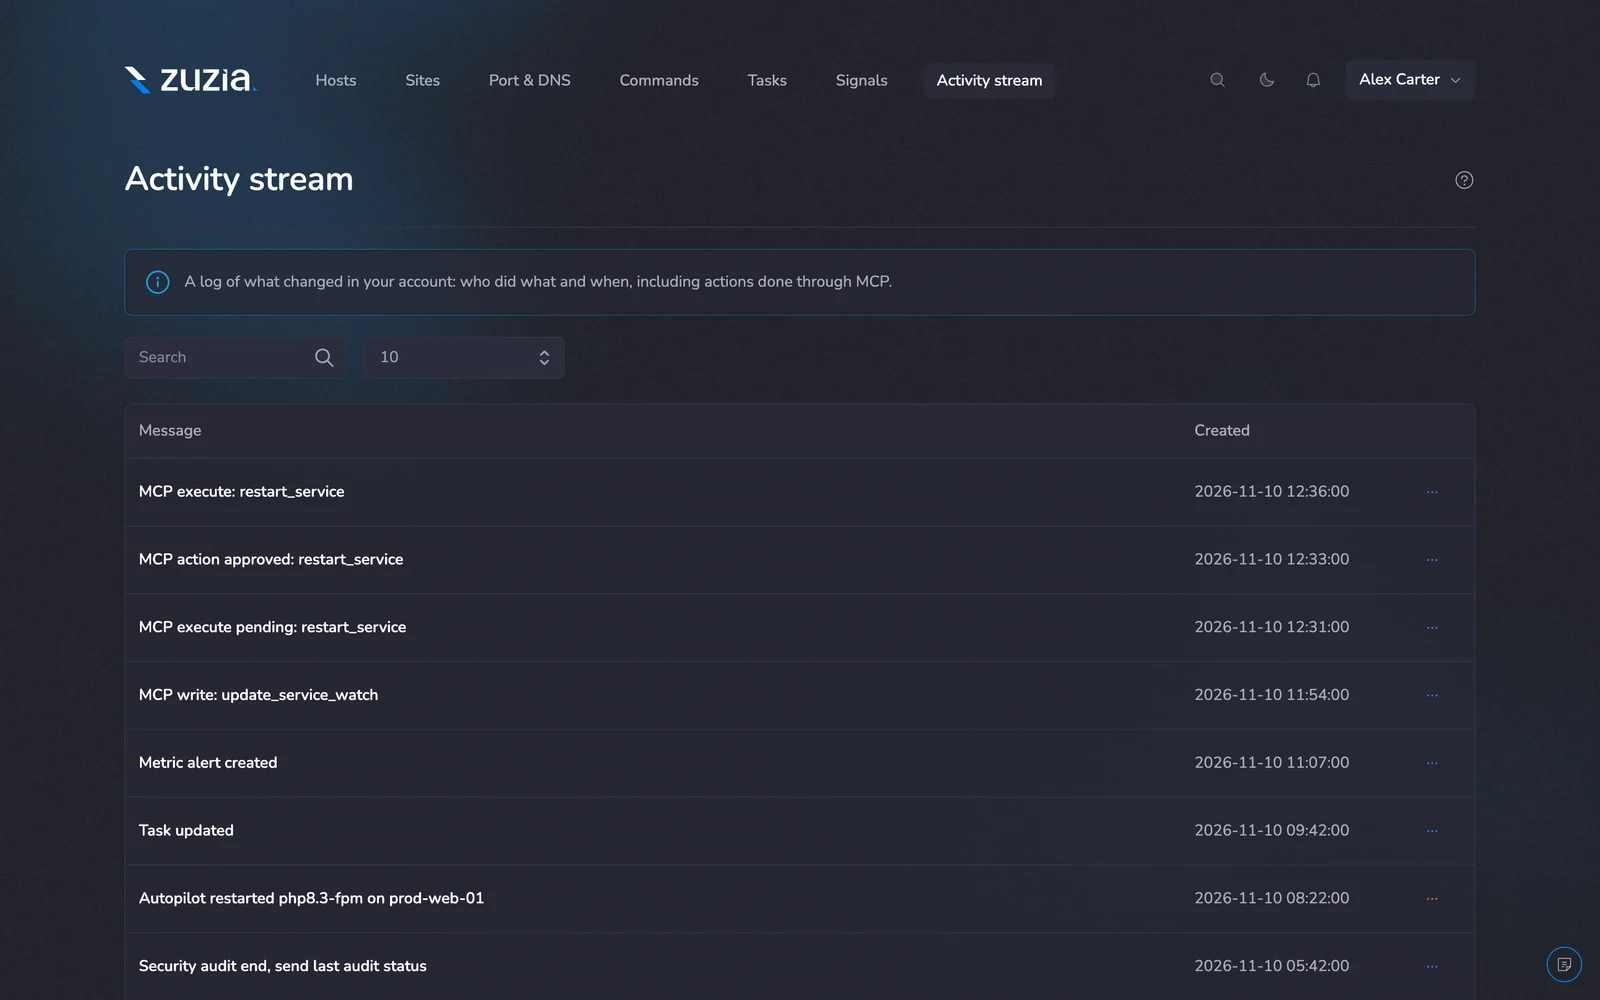
Activity stream
A log of what changed in the account: who did what and when, including Autopilot restarts and actions done through MCP.
MCP server for AI assistants
Connect Claude Code, Cursor or VS Code and ask about your servers. You decide what the assistant can read and what it can do.
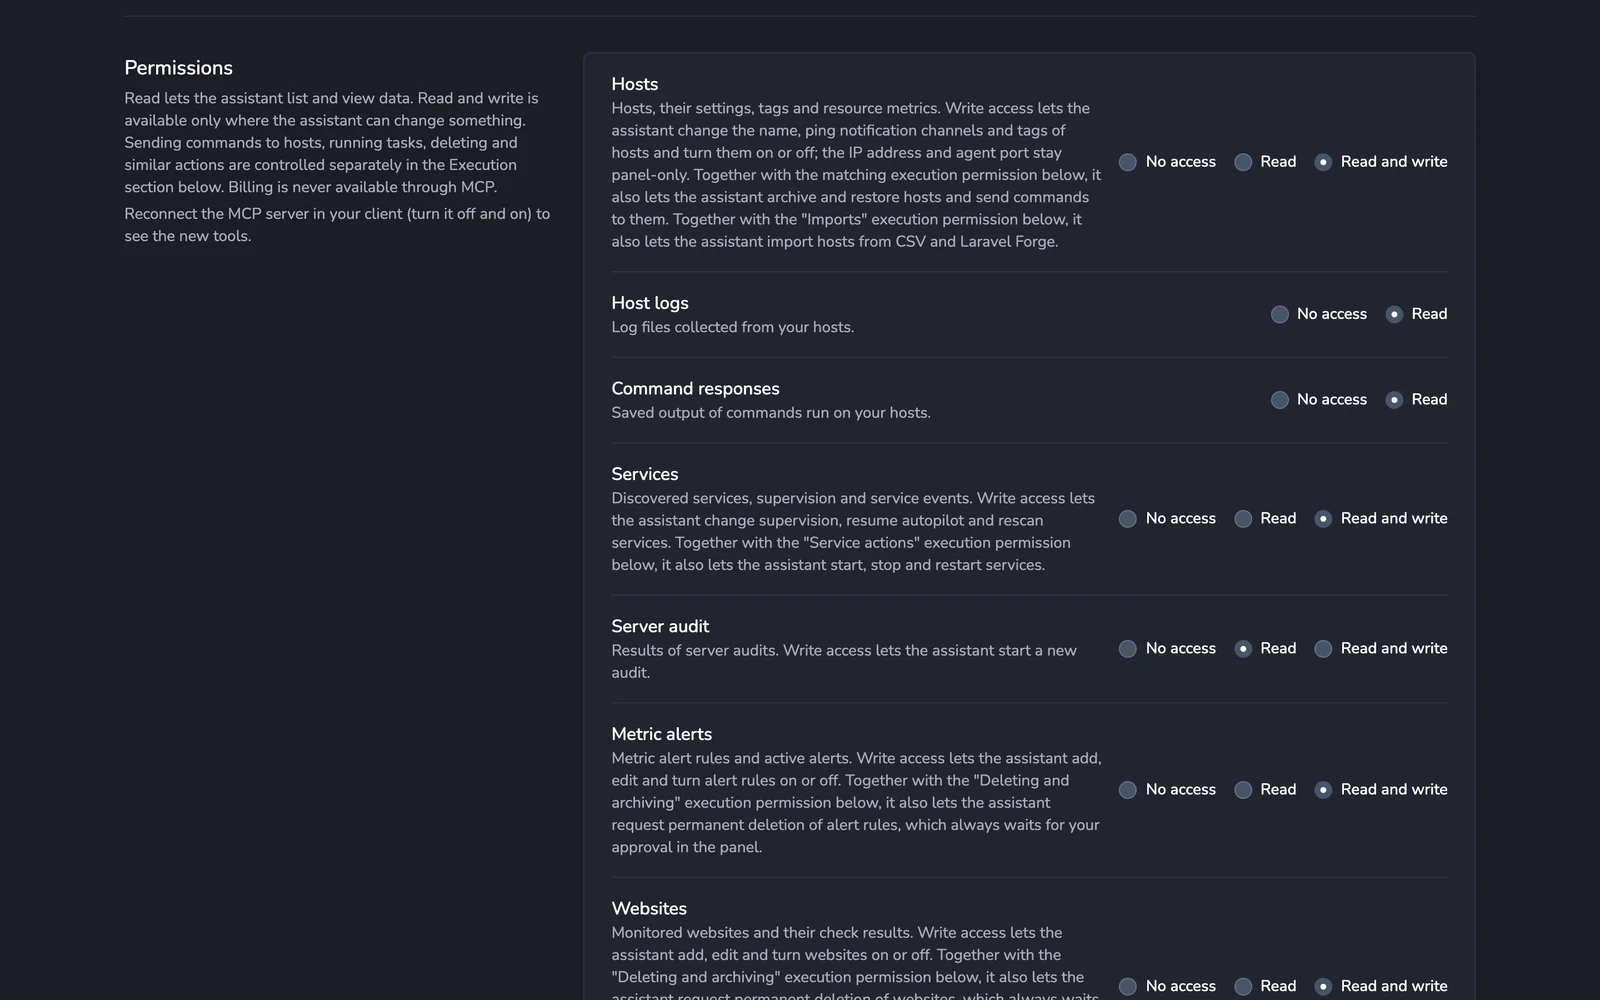
Read and write permissions per area
Each area has its own setting: no access, read, or read and write. Billing is never available through MCP.
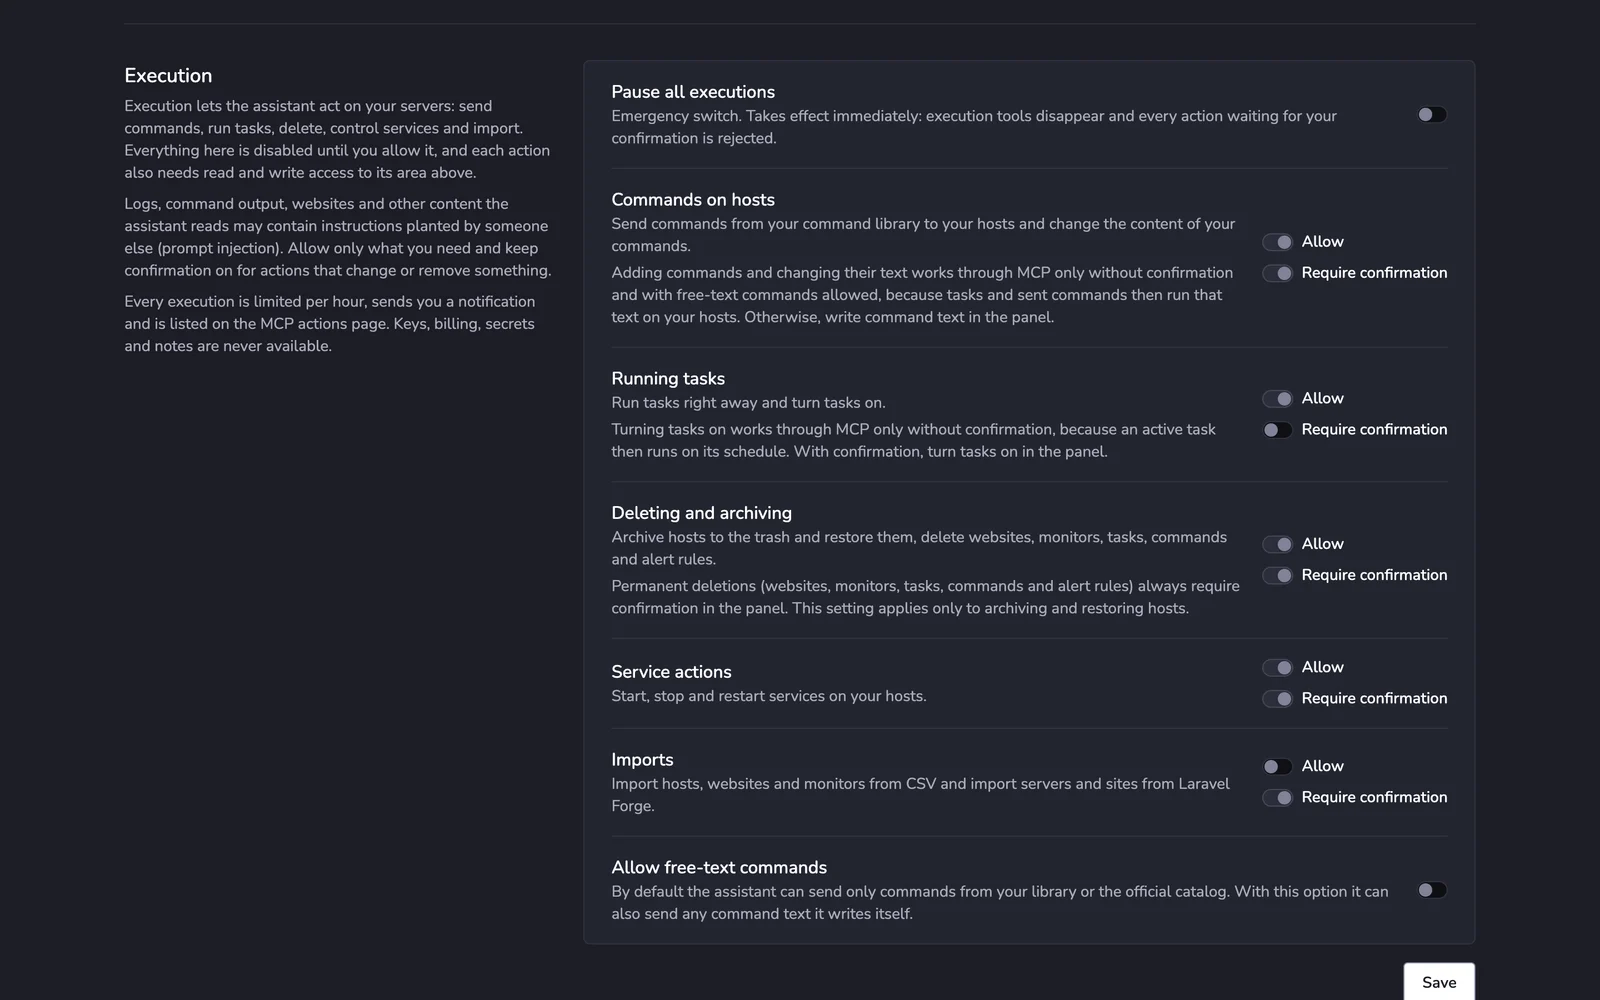
Execution settings
Everything that acts on a server is off until you allow it, and each action type can require your confirmation. One switch pauses all executions.
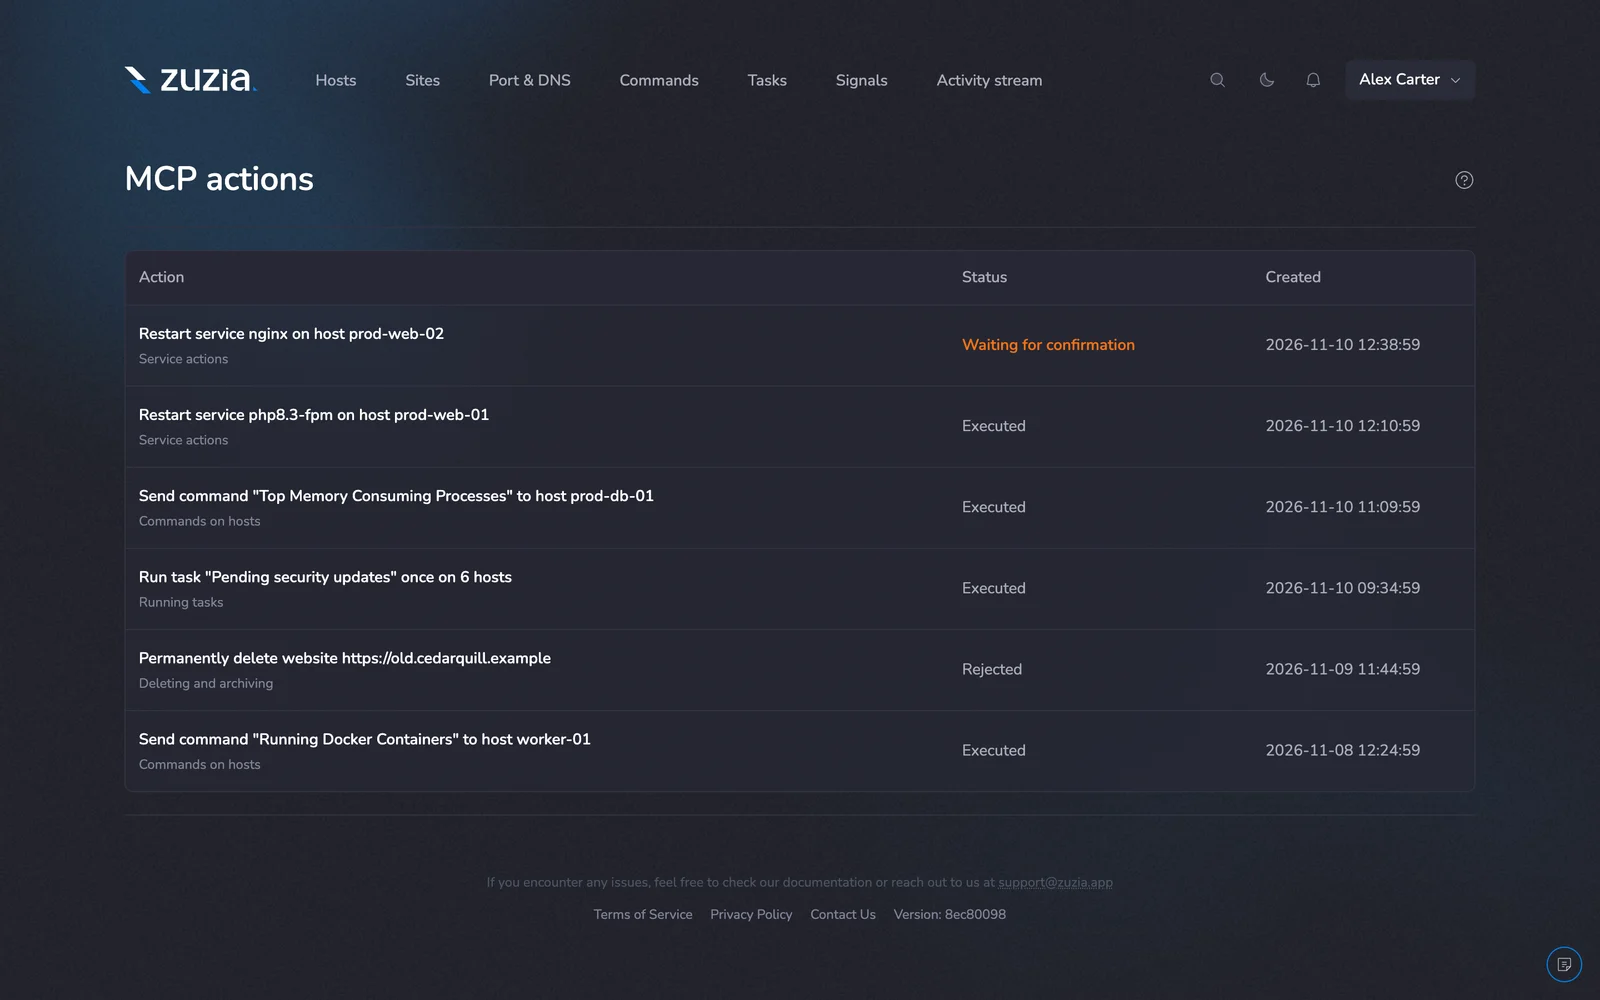
MCP actions history
Every action an assistant asked for, with its status: waiting for confirmation, executed or rejected.
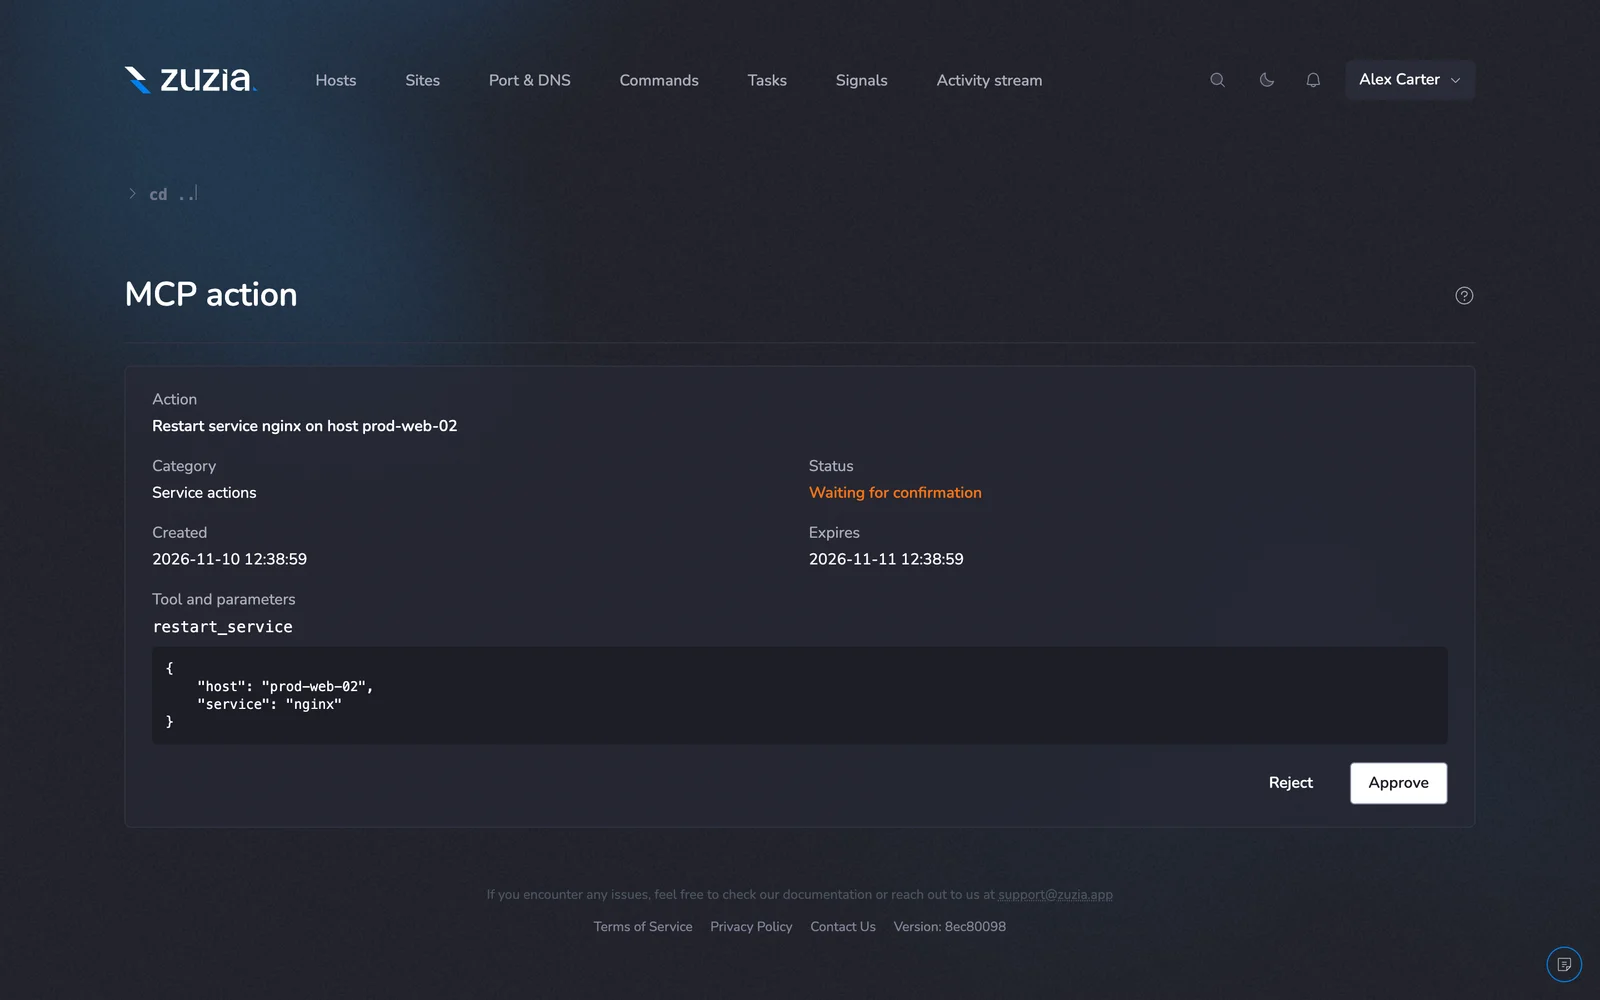
Approve or reject an action
Before a risky action runs you see the exact tool and parameters, and approve or reject it in the panel.
See it with your own servers
New accounts get 14 days of the full Starter plan, no card. Then the Free Forever plan covers 1 host and 10 websites.
Press kit
Writing about Zuzia, or adding it to a directory or a comparison? You can use the screenshots, the logo and the descriptions below without asking. Please link to zuzia.app as the source. Click any screenshot above to open the full-size PNG.

